Pictograph
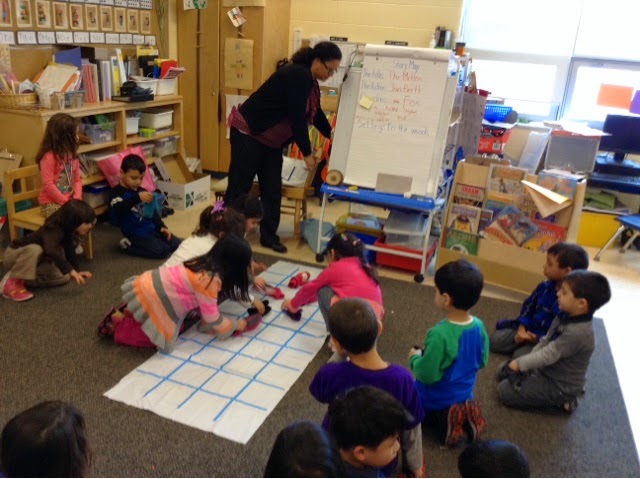
Today as part of our math lesson we took a look at how to make a picture graph.
After reading "The Mitten" book this morning we thought what a great idea for
graphing. We asked the children to bring 1 mitten or glove which ever they wear
to school to the carpet. We began by labeling the graph the two middle columns with
a picture of a glove or a mitten. The children were asked to come up and place their
mitten or glove in the appropriate column. Most of our children were able to place
their item in the correct column. Then we asked questions like...
How many gloves are they?
How many mittens are there?
How many more mittens are there than gloves?
Which one has the least amount?
How many more mittens are there than gloves?
Then we talked about where would you begin to count on the graph to find out our answers.
Our students were very excited yelling out their guesses and Realm one of our JK friends
gave us the correct answer. She came to the graph and pointed to the point where the mittens
and the gloves match. So we would begin to count after that point. Way to go Realm.
What does this graph tell us? asked Mrs.Osborne
Anabiya answered "The mitten have alot and the gloves have less".


What do our friends like more?
answer: the mittens!
Is it easier to wear gloves or mittens?
they answered mittens.
No comments:
Post a Comment